Ubuntu搭建ELK实时日志分析平台
1 系统环境
Ubuntu 16.04 LTS elasticsearch-6.1.2.tar.gz logstash-6.1.2.tar.gz kibana-6.1.2-linux-x86_64.tar.gz filebeat-6.1.2-linux-x86_64.tar.gz2 ELK介绍
Elasticsearch:是一个分布式、可扩展、实时的搜索与数据分析引擎,具有高可伸缩、高可靠等特点。基于全文搜索引擎库Apache Lucene基础之上,能对大容量的数据进行接近实时的存储、搜索和分析操作。
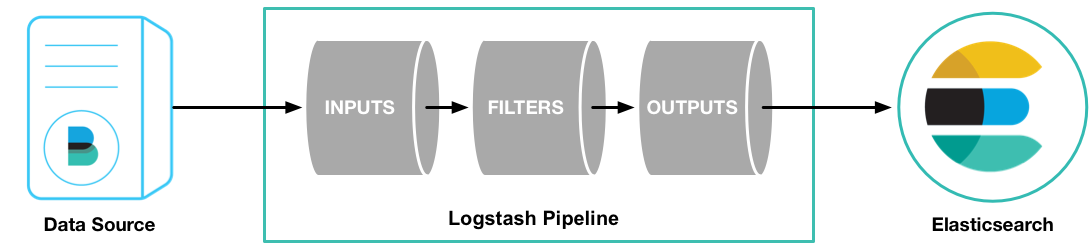
Logstash:数据处理引擎,能够同时从多个来源采集数据,通过过滤器解析、转换数据,最后输出到存储库Elasticsearch。
Kibana:数据分析与可视化平台,结合Elasticsearch使用,对数据进行汇总、搜索和分析,利用图表、报表、地图组件对数据进行可视化分析。
3 搭建过程
官网下载tar包并上传至服务器
3.1 安装ElasticSearch
1.解压elasticsearch tar包
tar -zxvf elasticsearch-6.1.2.tar.gz2.修改配置config/elasticsearch.yml,在es目录下创建data和logs文件夹
cluster.name: elk-test
node.name: node-1
path.data: /opt/apps/elk/elasticsearch-6.1.2/data
path.logs: /opt/apps/elk/elasticsearch-6.1.2/logs
network.host: 172.17.0.15
http.port: 9200
3.启动elasticsearch服务
./elasticsearch &出现异常提示:不能以root用户运行elasticsearch
org.elasticsearch.bootstrap.StartupException: java.lang.RuntimeException: can not run elasticsearch as root
	at org.elasticsearch.bootstrap.Elasticsearch.init(Elasticsearch.java:125) ~[elasticsearch-6.1.2.jar:6.1.2]
	at org.elasticsearch.bootstrap.Elasticsearch.execute(Elasticsearch.java:112) ~[elasticsearch-6.1.2.jar:6.1.2]
	at org.elasticsearch.cli.EnvironmentAwareCommand.execute(EnvironmentAwareCommand.java:86) ~[elasticsearch-6.1.2.jar:6.1.2]
	at org.elasticsearch.cli.Command.mainWithoutErrorHandling(Command.java:124) ~[elasticsearch-cli-6.1.2.jar:6.1.2]
	at org.elasticsearch.cli.Command.main(Command.java:90) ~[elasticsearch-cli-6.1.2.jar:6.1.2]
	at org.elasticsearch.bootstrap.Elasticsearch.main(Elasticsearch.java:92) ~[elasticsearch-6.1.2.jar:6.1.2]
	at org.elasticsearch.bootstrap.Elasticsearch.main(Elasticsearch.java:85) ~[elasticsearch-6.1.2.jar:6.1.2]
Caused by: java.lang.RuntimeException: can not run elasticsearch as root
	at org.elasticsearch.bootstrap.Bootstrap.initializeNatives(Bootstrap.java:104) ~[elasticsearch-6.1.2.jar:6.1.2]
	at org.elasticsearch.bootstrap.Bootstrap.setup(Bootstrap.java:171) ~[elasticsearch-6.1.2.jar:6.1.2]
	at org.elasticsearch.bootstrap.Bootstrap.init(Bootstrap.java:322) ~[elasticsearch-6.1.2.jar:6.1.2]
	at org.elasticsearch.bootstrap.Elasticsearch.init(Elasticsearch.java:121) ~[elasticsearch-6.1.2.jar:6.1.2]
	... 6 more
原因:由于elasticsearch可以接收用户输入的脚本并且执行,所以系统为了安全考虑设置了条件。
解决:root用户下创建新用户用于测试elasticsearch
# 创建elk用户组
groupadd elk
# 创建elk用户并指定用户组elk
useradd elk -g elk
# 修改elasticsearch-6.1.2文件夹拥有者和所属群组
chown elk:elk elasticsearch-6.1.2
切换至elk用户,再次启动 elasticsearch,出现以下错误提示
ERROR: bootstrap checks failed
max virtual memory areas vm.max_map_count [65530] is too low, increase to at least [262144]
原因:elasticsearch默认使用混合mmapfs/niofs目录来存储其索引,对mmap计数的默认操作系统限制可能过低,可能导致内存不足异常。
解决:切换root用户,修改内核参数vm.max_map_count
# 内核参数配置文件/etc/sysctl.conf添加配置
vm.max_map_count = 262144
# 使配置生效
sysctl -p
切换回elk用户,重新启动elasticsearch
4.验证是否启动成功
curl 'http://172.17.0.15:9200'elk@VM-0-15-ubuntu:/opt/apps/elk/elasticsearch-6.1.2/bin$ curl 'http://172.17.0.15:9200'
{
"name" : "node-1",
"cluster_name" : "elk-test",
"cluster_uuid" : "TCnmKbwNRGi29UdtrBXqUQ",
"version" : {
"number" : "6.1.2",
"build_hash" : "5b1fea5",
"build_date" : "2018-01-10T02:35:59.208Z",
"build_snapshot" : false,
"lucene_version" : "7.1.0",
"minimum_wire_compatibility_version" : "5.6.0",
"minimum_index_compatibility_version" : "5.0.0"
},
"tagline" : "You Know, for Search"
}返回以上内容说明启动成功。
3.2 安装Logstash
1.解压logstash tar包
tar -zxvf logstash-6.1.2.tar.gzLogstash Pipeline有两个必须的部分,输入和输出,以及可选部分过滤器。输入插件消费某个来源的数据,过滤器插件根据设置处理数据,输出插件将数据写到目标存储库。
2.运行logstash最基础的pipeline
bin/logstash -e 'input { stdin { } } output { stdout {} }'-e:可以直接用命令行配置,无需使用文件配置。当前pipeline从标准输入获取数据stdin,并把结构化数据输出到标准输出stdout。
Pipeline启动之后,控制台输入hello world,可看到对应输出。
[2018-03-29T17:56:47,221][INFO ][logstash.pipeline        ] Pipeline started {"pipeline.id"=>"main"}
The stdin plugin is now waiting for input:
hello world
2018-03-29T10:11:08.535Z localhost.localdomain hello world
3.安装logstash-input-beats插件
./bin/logstash-plugin install logstash-input-beats4.创建pipeline配置文件logstash.conf,配置端口5044监听beats的连接,并创建elasticsearch索引。
input {
  beats {
    port => 5044
  }
}

output {
  elasticsearch {
    hosts => "172.17.0.15:9200"
    manage_template => false
    index => "%{[@metadata][beat]}-%{[@metadata][version]}-%{+YYYY.MM.dd}"
    document_type => "%{[@metadata][type]}"
  }
}
5.启动logstash服务
./bin/logstash -f config/logstash.conf &elk@VM-0-15-ubuntu:/opt/apps/elk/logstash-6.1.2$ ./bin/logstash -f config/logstash.conf &
......
[2018-03-30T16:58:59,862][INFO ][logstash.pipeline ] Starting pipeline {:pipeline_id=>"main", "pipeline.workers"=>1, "pipeline.batch.size"=>125, "pipeline.batch.delay"=>5, "pipeline.max_inflight"=>125, :thread=>"#<Thread:0x7d1971cc run>"}
[2018-03-30T16:59:00,769][INFO ][logstash.inputs.beats ] Beats inputs: Starting input listener {:address=>"0.0.0.0:5044"}
[2018-03-30T16:59:00,909][INFO ][logstash.pipeline ] Pipeline started {"pipeline.id"=>"main"}
[2018-03-30T16:59:01,094][INFO ][org.logstash.beats.Server] Starting server on port: 5044
[2018-03-30T16:59:01,172][INFO ][logstash.agent ] Pipelines running {:count=>1, :pipelines=>["main"]}3.3 安装Kibana
1.解压kibana tar包
tar -zxvf kibana-6.1.2-linux-x86_64.tar.gz2.修改kibana配置
# kibana地址
server.host: "172.17.0.15"
# elasticsearch地址
elasticsearch.url: "http://172.17.0.15:9200"
3.启动kibana服务
./bin/kibana &elk@VM-0-15-ubuntu:/opt/apps/elk/kibana-6.1.2-linux-x86_64$ ./bin/kibana &
[1] 6462
elk@VM-0-15-ubuntu:/opt/apps/elk/kibana-6.1.2-linux-x86_64$ log [06:19:51.279] [info][status][plugin:kibana@6.1.2] Status changed from uninitialized to green - Ready
log [06:19:51.326] [info][status][plugin:elasticsearch@6.1.2] Status changed from uninitialized to yellow - Waiting for Elasticsearch
log [06:19:51.369] [info][status][plugin:console@6.1.2] Status changed from uninitialized to green - Ready
log [06:19:51.396] [info][status][plugin:metrics@6.1.2] Status changed from uninitialized to green - Ready
log [06:19:51.779] [info][status][plugin:timelion@6.1.2] Status changed from uninitialized to green - Ready
log [06:19:51.788] [info][listening] Server running at http://172.17.0.15:5601
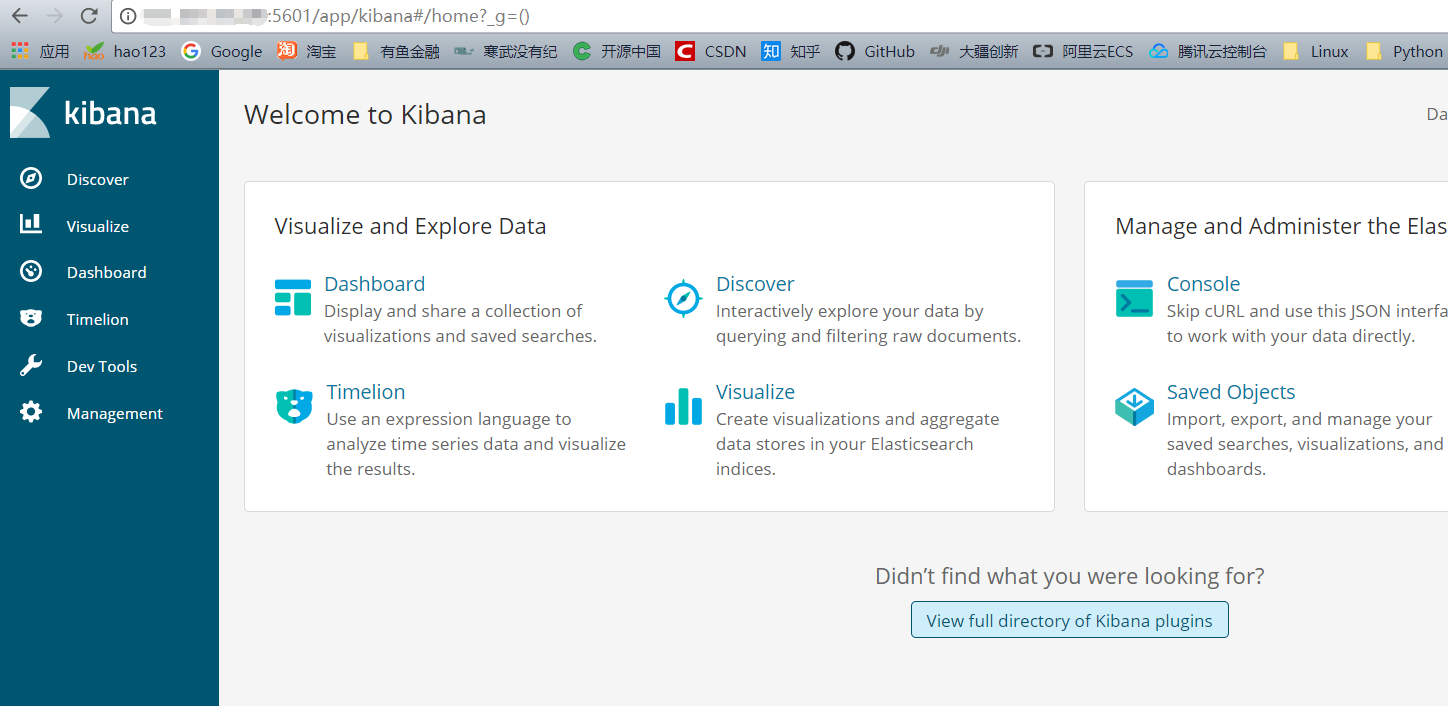
log [06:19:51.803] [info][status][plugin:elasticsearch@6.1.2] Status changed from yellow to green - Ready4.浏览器访问确认服务启动
http://X.X.X.X:5601 (修改成你所用内网或公网地址)
3.4 安装Filebeat
1.解压filebeat tar包
tar -zxvf filebeat-6.1.2-linux-x86_64.tar.gz2.配置filebeat
我们这里输出到logstash,需要添加logstash信息,注释elasticsearch信息
filebeat.prospectors:
- type: log
  enabled: true
  paths:
- /opt/apps/elk/*.log
#output.elasticsearch:
  #hosts: ["localhost:9200"]
output.logstash:
  hosts: ["172.17.0.15:5044"]
3.测试配置
./filebeat -configtest -eelk@VM-0-15-ubuntu:/opt/apps/elk/filebeat-6.1.2-linux-x86_64$ ./filebeat -configtest -e
2018/03/30 09:36:59.643810 beat.go:436: INFO Home path: [/opt/apps/elk/filebeat-6.1.2-linux-x86_64] Config path: [/opt/apps/elk/filebeat-6.1.2-linux-x86_64] Data path: [/opt/apps/elk/filebeat-6.1.2-linux-x86_64/data] Logs path: [/opt/apps/elk/filebeat-6.1.2-linux-x86_64/logs]
2018/03/30 09:36:59.644091 beat.go:443: INFO Beat UUID: 1fed59c6-c26f-428c-8914-3ff2716b4b48
2018/03/30 09:36:59.644177 beat.go:203: INFO Setup Beat: filebeat; Version: 6.1.2
2018/03/30 09:36:59.642718 metrics.go:23: INFO Metrics logging every 30s
2018/03/30 09:36:59.660871 module.go:76: INFO Beat name: VM-0-15-ubuntu
2018/03/30 09:36:59.661139 cfgwarn.go:18: WARN DEPRECATED: -configtest flag has been deprecated, use configtest subcommand Will be removed in version: 6.0
Config OK4.导出索引模板配置文件
./filebeat export template > filebeat.template.json5.手动安装模板
curl -XPUT -H 'Content-Type: application/json' http://172.17.0.15:9200/_template/filebeat-6.1.2 -d@filebeat.template.json6.如果已经使用filebeat将数据索引到elasticsearch中,则索引可能包含旧文档。加载 Index Pattern 后,您可以从filebeat- * 中删除旧文档,以强制 Kibana 查看最新的文档
curl -XDELETE 'http://172.17.0.15:9200/filebeat-*'7.启动filebeat
./filebeat -e -c filebeat.yml -d "publish" &4 Kibana简单使用
1.访问kibana地址(http://X.X.X.X:5601)
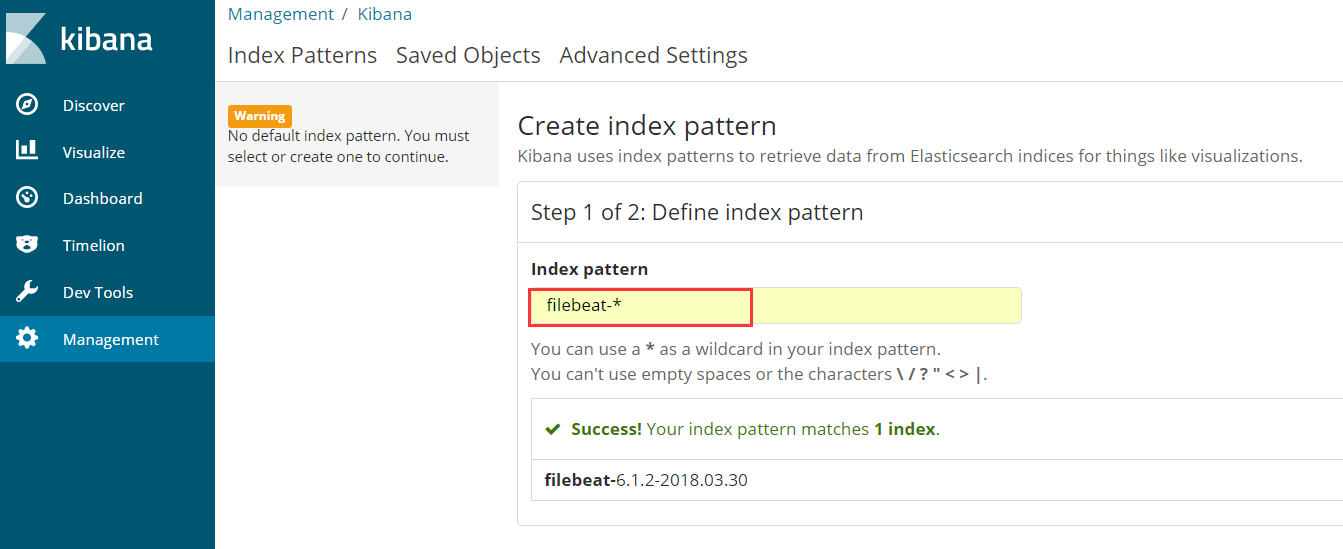
2.Discover模块默认是没有Index Pattern,需要在 Management 模块中创建一个,这里我们创建一个 filebeat-* 的Index Pattern。
3.返回Discover模块,如下说明添加成功。
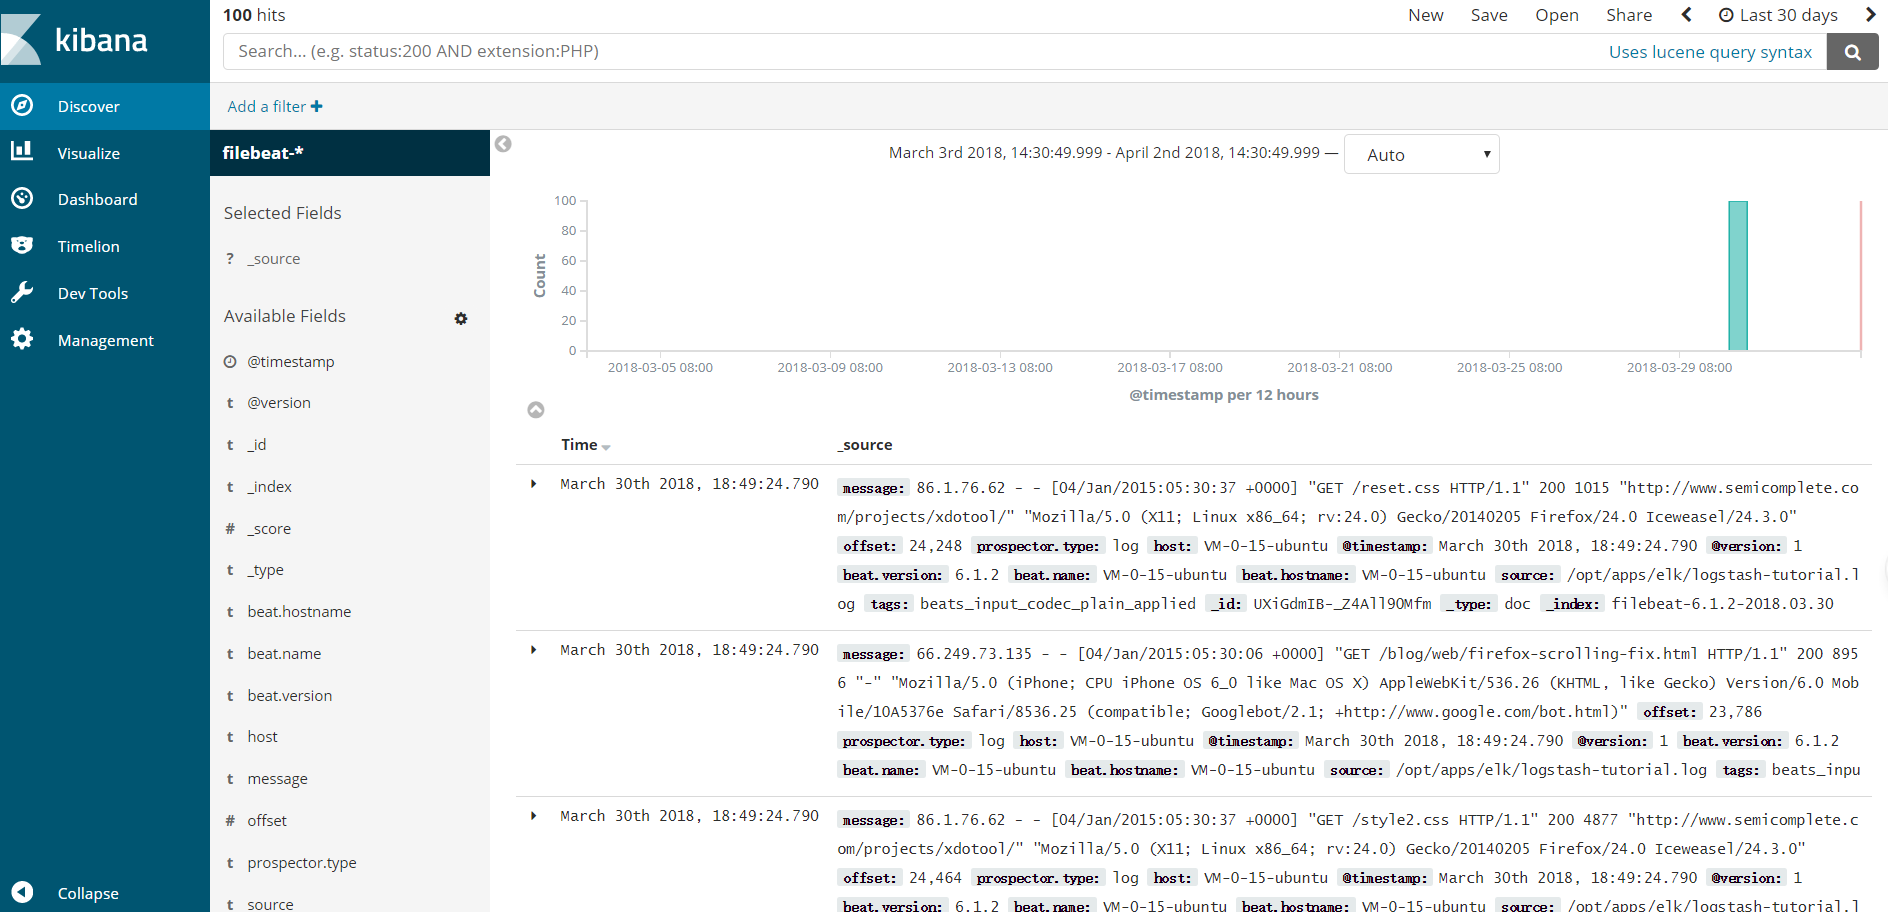
4.在搜索框输入关键字可在当前选择的Index Pattern基础上进行筛选。

5 参考资料
https://www.elastic.co/guide/en/elasticsearch/reference/current/index.html
https://www.elastic.co/guide/en/logstash/current/index.html
https://www.elastic.co/guide/en/kibana/current/index.html
https://www.elastic.co/guide/en/beats/filebeat/current/index.html
https://www.jianshu.com/p/934c457a333c
文章来源:
Author:LaravelShao
link:https://my.oschina.net/LaravelShao/blog/1790787